Analytics
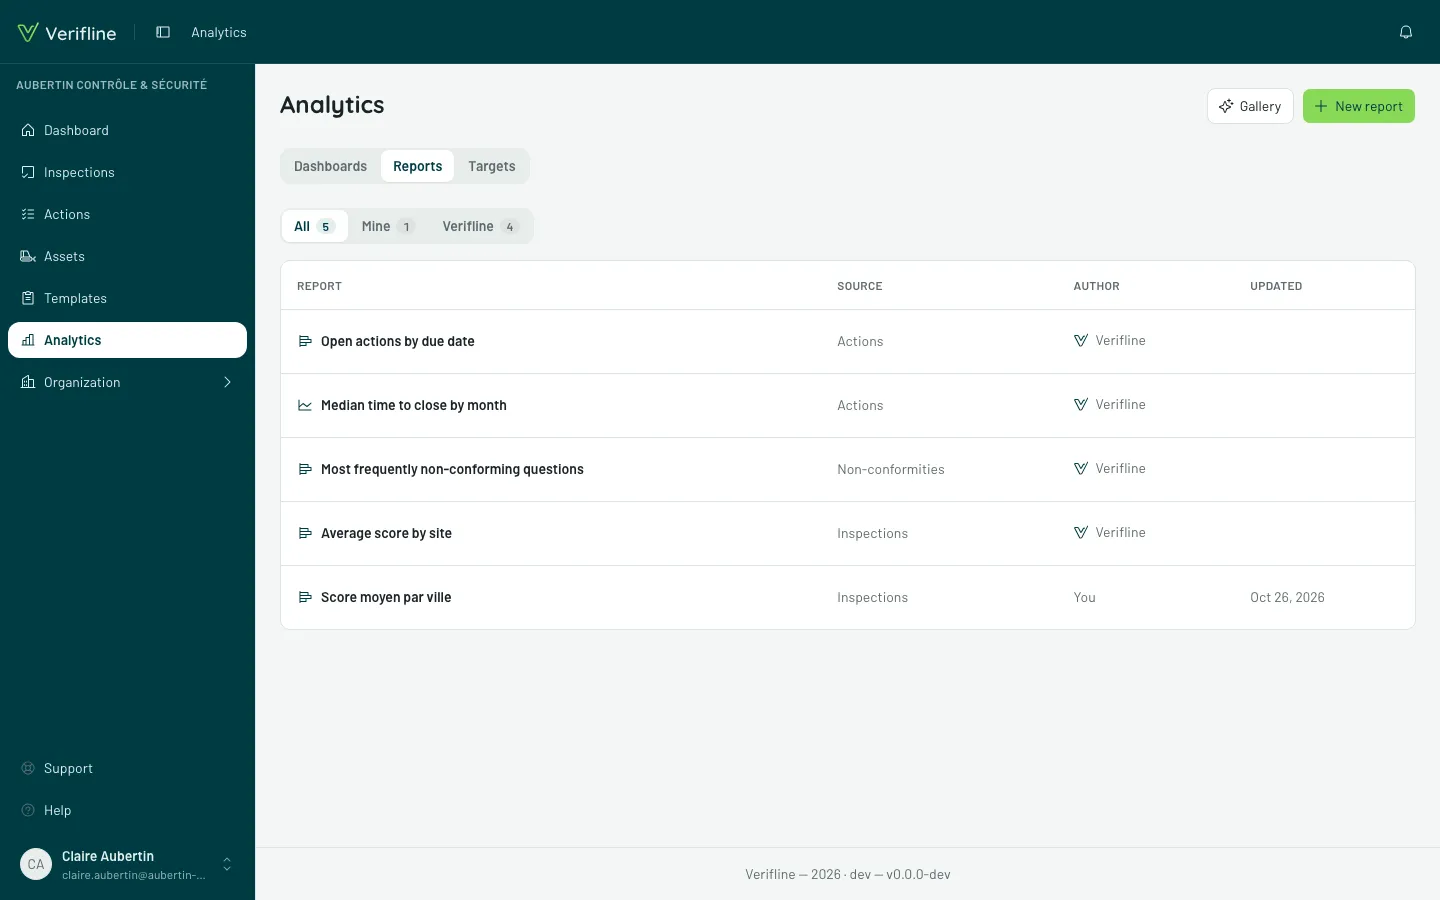
Analytics answers the next question. Once the inspections are done and the actions launched: where do we stand? How many inspections this month, what score, where non-conformities keep coming back, which actions are dragging. The Analytics entry in the sidebar brings all of it together.
Three objects that fit together
Section titled “Three objects that fit together”- A report is a calculation on your data: a figure, a chart or a table. “Average score by site”, “Overdue actions by priority”.
- A dashboard places reports side by side, under one filter bar: changing the period changes every tile at once.
- A target is a goal — “average score ≥ 85%” — drawn on the reports that measure the same thing.
The application’s home screen is a dashboard: the first one, built by Verifline.
Where to start
Section titled “Where to start”- Open Analytics, then Gallery: Add a Verifline report — “Average score by site”, for instance (Reports).
- Open it: change its period, export it as an image.
- New dashboard: place that report on it, with a module from the home screen next to it (Dashboards).
- When a number matters, give it a target in the Targets tab (Targets).
For a report the gallery does not have: Build a report.
Who can do what
Section titled “Who can do what”The Analytics domain of roles follows the usual groupings:
- View — open the dashboard and Analytics, read shared reports, dashboards and targets;
- Contribute — add your own: build, duplicate, share, then edit and delete what you built;
- Manage — also edit what others have shared;
- Configure — customize the organization’s dashboard.
The Inspector only has their home dashboard; the Fleet manager and Management view; the Site lead contributes; the Quality manager and the Administrator manage and configure.