Dashboards
A dashboard brings tiles together on a grid, under one filter bar: changing the period, the site or the template changes every tile at once. It is Private — its label says so — or shared with the organization, like a report. The application’s home screen is one.
Report or module?
Section titled “Report or module?”A tile shows a report, a module or a text (section title, subtitle, paragraph).
- A report is a calculation you choose: a source, measures, groupings, a visualization. Yours can be edited; a Verifline report is duplicated to become yours. It opens on its own, outside the dashboard, and can carry a target.
- A module is a block of the home screen, designed by Verifline and ready as is: it has no settings. Some are about you (your overdue actions, your inspections in progress), others about your scope. They lead to the items in one click — an action, an inspection. Each one is presented in Modules.
Reports and modules follow the same filter bar.
Build a dashboard
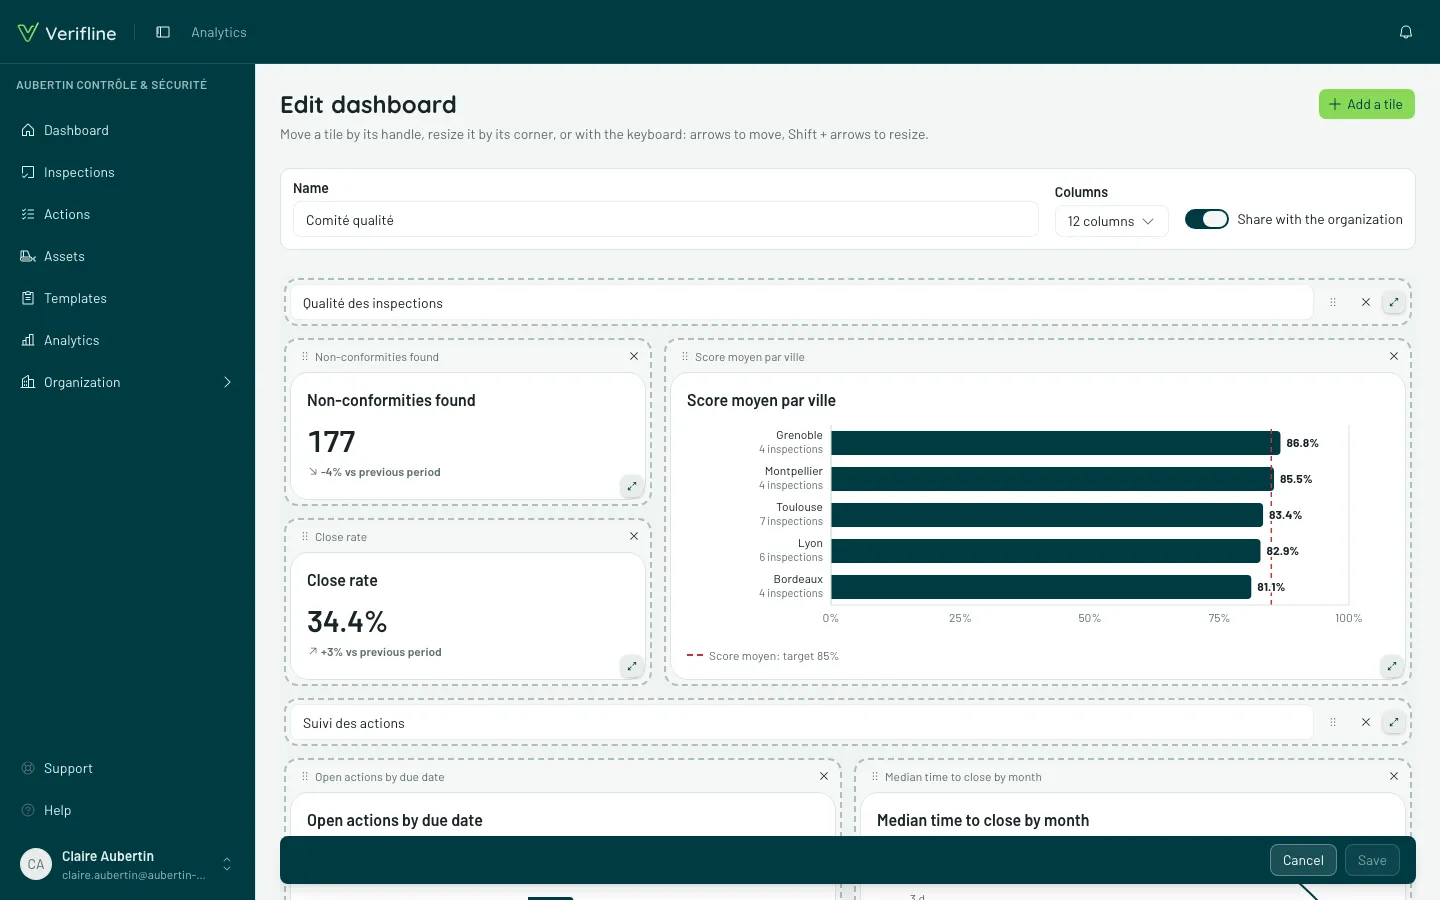
Section titled “Build a dashboard”New dashboard asks for a name, then opens the grid. In Edit mode:
- Add a tile offers a report (Your reports, then the Verifline reports, always available), a module or a text;
- a tile moves by its handle and resizes by its corner. With the keyboard: arrows move it, Shift + arrows resize it;
- Columns sets how fine the grid is: 4, 6, 8 or 12;
- nothing is saved before Save.
Read and filter
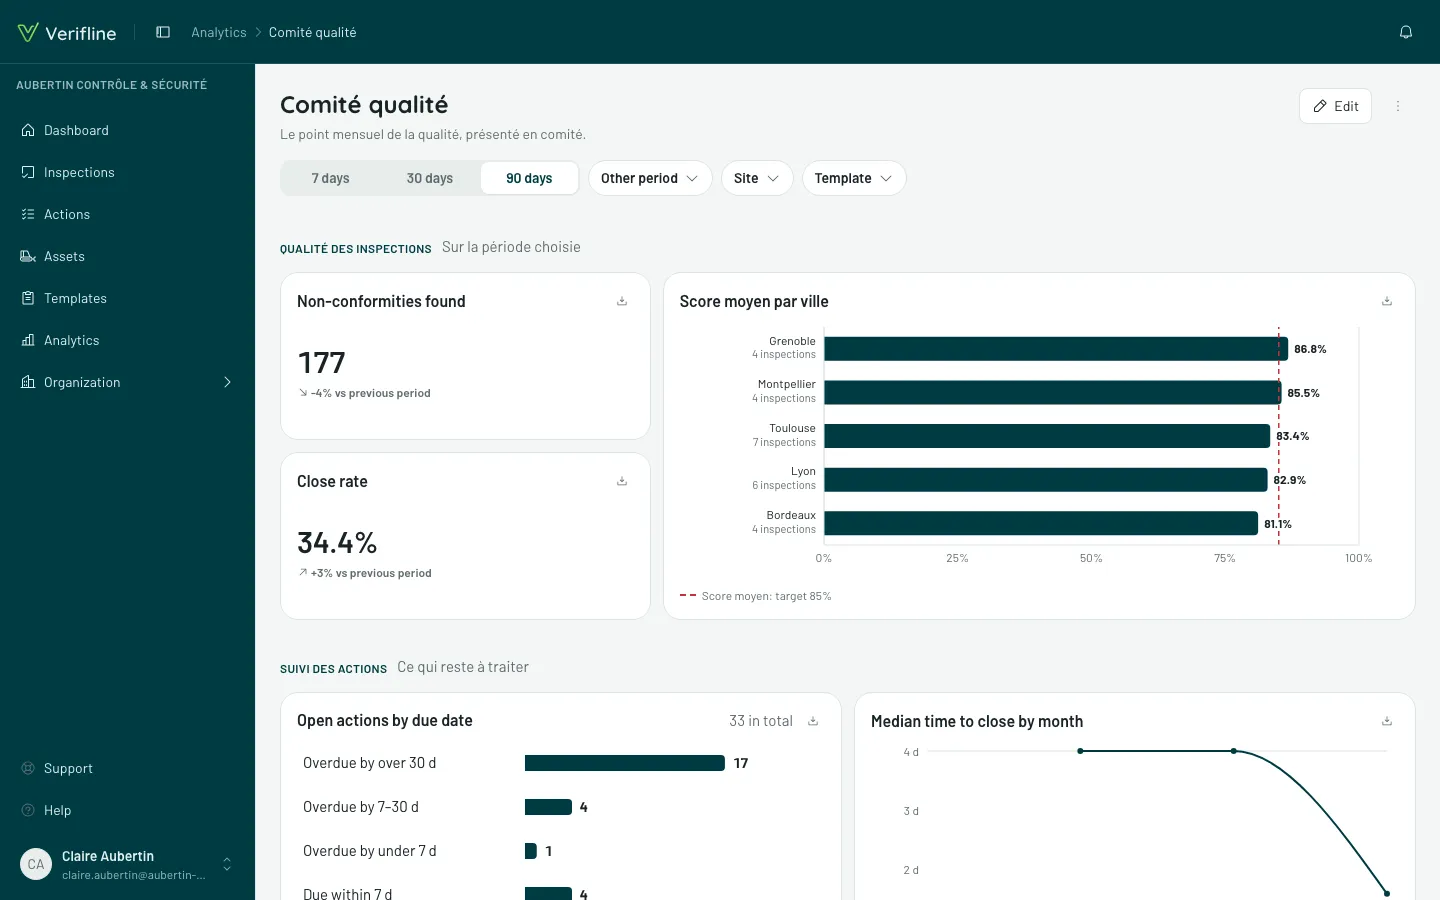
Section titled “Read and filter”When reading, the filter bar — period, site, template — applies to every tile. A tile that counts (inspections, actions) shows its total in its header: “27 in total”.
Two cases announce themselves. A tile whose source does not know a filter says so under its chart, instead of silently ignoring it. A tile your role does not allow you to read disappears, and the grid closes up without leaving a gap; a section with nothing left goes away with its title. A chart or a list with nothing to show for the period says so and folds down to its title, instead of drawing empty bars: what follows moves up. A counter at zero keeps its number — zero is a result.
Export, print, duplicate
Section titled “Export, print, duplicate”These three gestures live in the ⋮ menu (More actions), at the top right of the dashboard:
- Export CSV produces a single file, one section per tile. A tile’s download icon exports its report alone — CSV, PNG or copied image, like a report opened on its own.
- Print lays the dashboard out on landscape A4, without the sidebar, with the date and period.
- Duplicate makes a dashboard that is yours. Its tiles cite the same reports — Verifline’s stay Verifline’s — and you move, remove or complete them with your own.
On a phone, the dashboard is for reading: no Edit and no ⋮ menu. Exporting the whole dashboard, printing it or duplicating it is done on a computer or a tablet; each tile’s download icon stays.