Build a report
New report opens the editor. On the left, what the report counts; on the right, the Preview, updating with every setting (Chart and Data tabs).
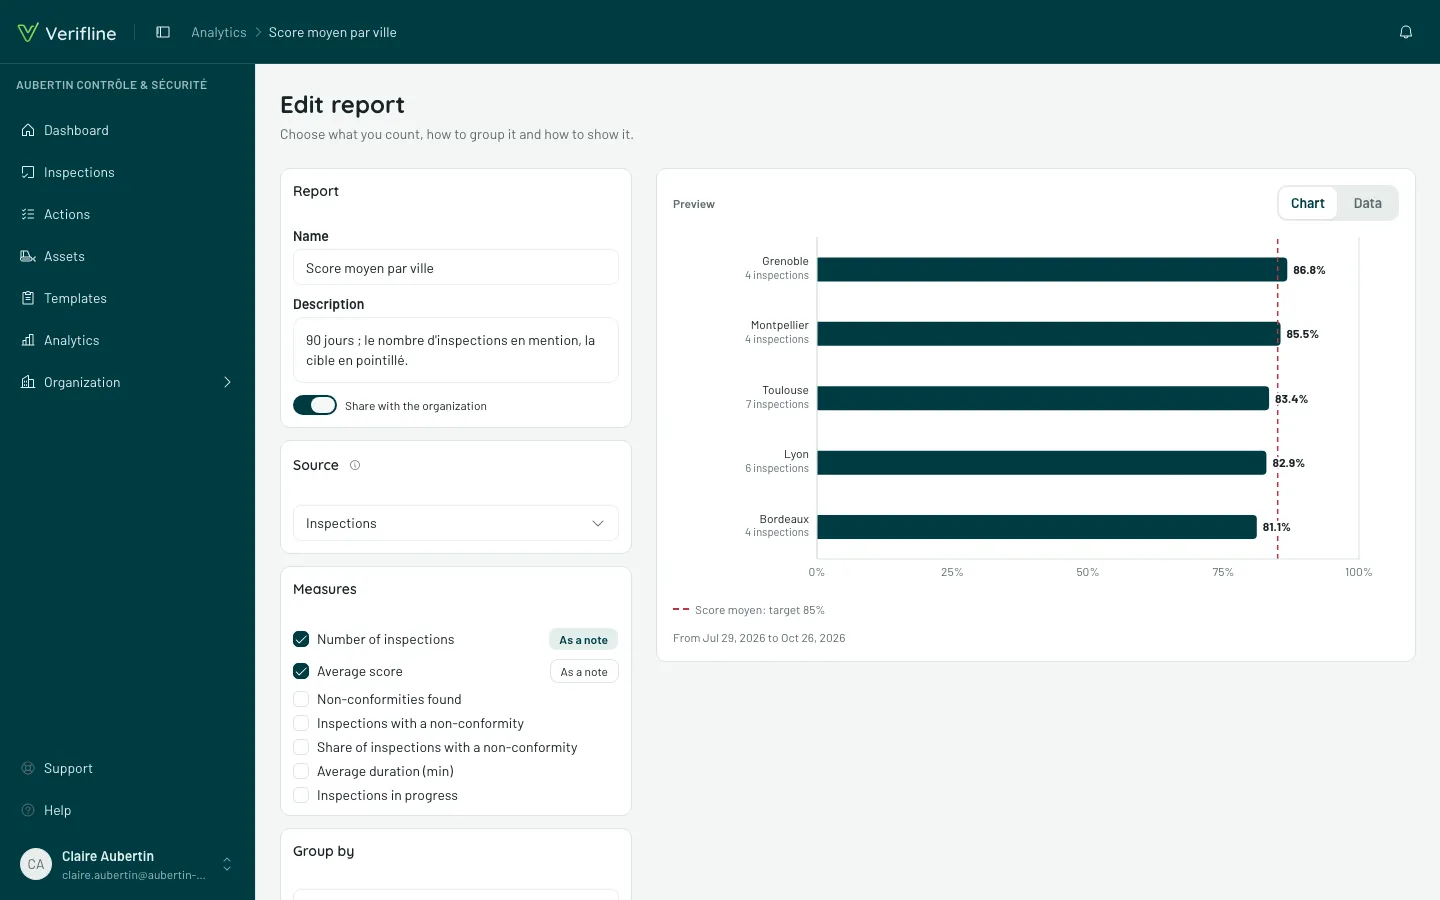
An example: average score by site
Section titled “An example: average score by site”A report reads like a sentence: the average score (the measure) of inspections (the source), by site (the grouping), over 90 days (the period). In the editor, in that order:
- Source: Inspections.
- Measures: Average score.
- Group by: Site.
- Period: 90 days.
- Visualization: Bars.
The preview shows one bar per site, the score at the end of each bar. Give it a Name, then Save: the report joins your list, Private.
The settings, one by one
Section titled “The settings, one by one”- Source — what the report counts over. Inspections: one row per inspection. Actions: one row per action. Non-conformities: one row per flagged answer of a completed inspection.
- Measures — what it counts. Depending on the source: count, average score, non-conformities found, share of inspections with a non-conformity, overdue actions, median time to close…
- Group by — how it splits. Site, template, inspector, status, priority, family, question, answer given, asset and asset category (for actions, if you see assets), or a date (by day, week, month, quarter). The site levels your organization has named — Building, Floor, Room, or Region, City, Site — are there too.
- Period — 7, 30, 90 days, 12 months, this month…
- Filters — what the report always keeps: a priority, some sites, a minimum score…
- Visualization — Figure, Bars, Columns, Line, Pie, Table. Colors: Brand, States or Monochrome, always in Verifline’s colors.
Going further
Section titled “Going further”- Keep the top N (on a grouping) limits the bars to the N largest and groups the rest into “Other”.
- As a note (once there are several measures) writes a measure small under each bar’s name — “12 inspections” — instead of drawing a bar. So 100% on a single inspection does not read like 100% on forty.
- Relative to today (on a date) groups by urgency: overdue by over 30 days, 7–30 days, under 7 days, due within 7 days, due later, no due date. On a creation date, it is the age.
- Current state (no period) counts what is open now — open, overdue actions. A current state does not move with a dashboard’s period.
- Targets draws on the chart the targets that measure what the report measures.
Share it
Section titled “Share it”A report is born Private, visible to you only. Share with the organization makes it readable by everyone, and the Private label goes away. A shared dashboard only shows shared reports.