Verifline reports
Verifline reports are defined by Verifline: Add (in the Gallery) puts them in your list without a copy, and they improve along with the application. They cannot be edited; Duplicate makes a copy that is yours. See Reports.
Each one is computed on your scope. In a dashboard, the dashboard’s period replaces theirs, except for a Current state — what is open now. The screenshots come from the demo organization.
On inspections
Section titled “On inspections”Non-conformities found
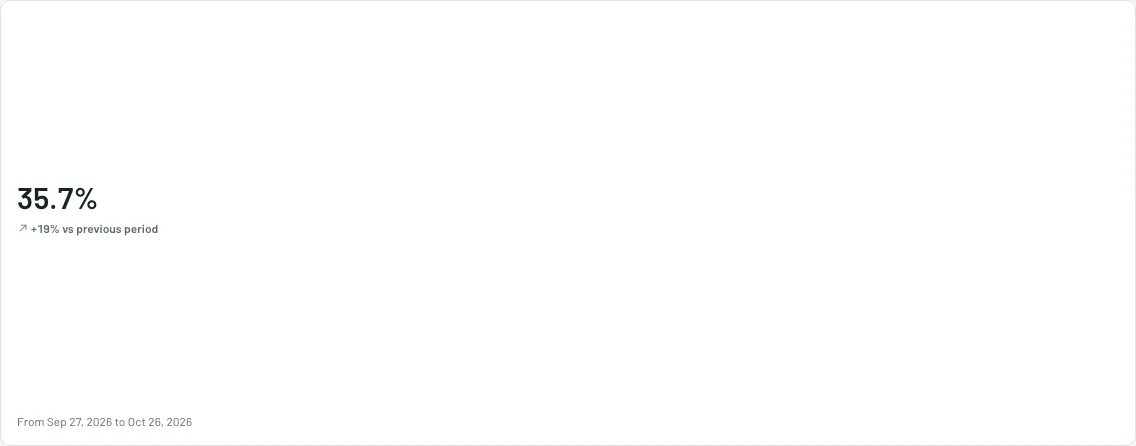
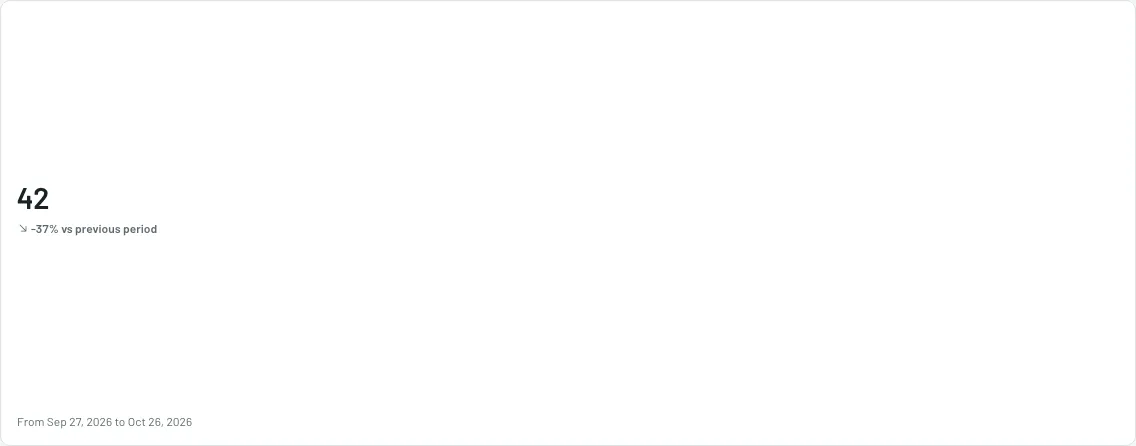
Section titled “Non-conformities found”The total of non-conformities found on inspections completed over the last 30 days, and the change from the 30 days before: the figure to follow from one week to the next.
Completed inspections by month
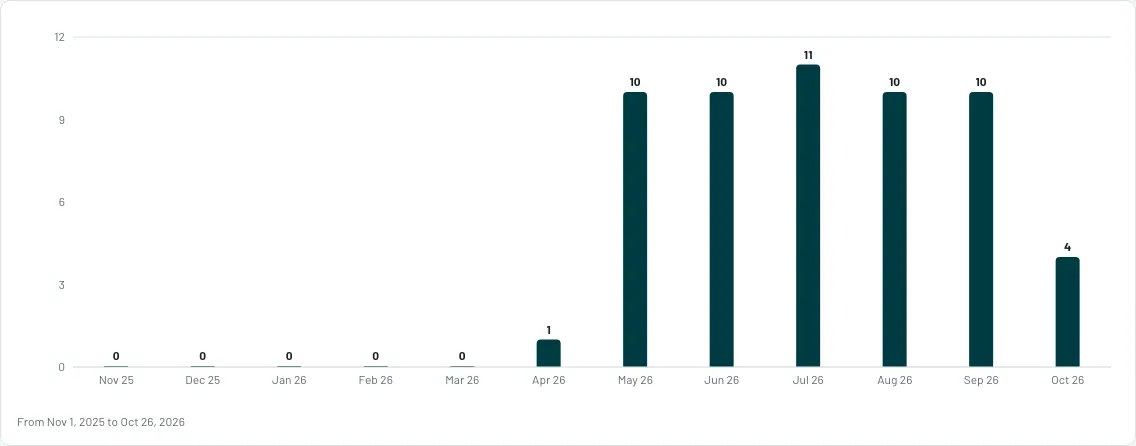
Section titled “Completed inspections by month”How many inspections were completed each month, over a rolling twelve months: the pace of the field, and its dips.
Average score by month
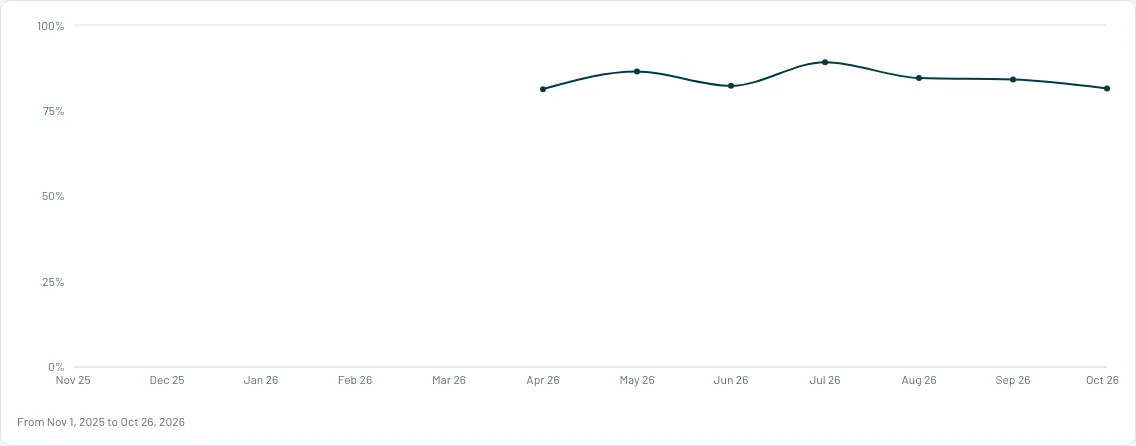
Section titled “Average score by month”The average score of completed inspections, month by month over twelve months: the quality trend.
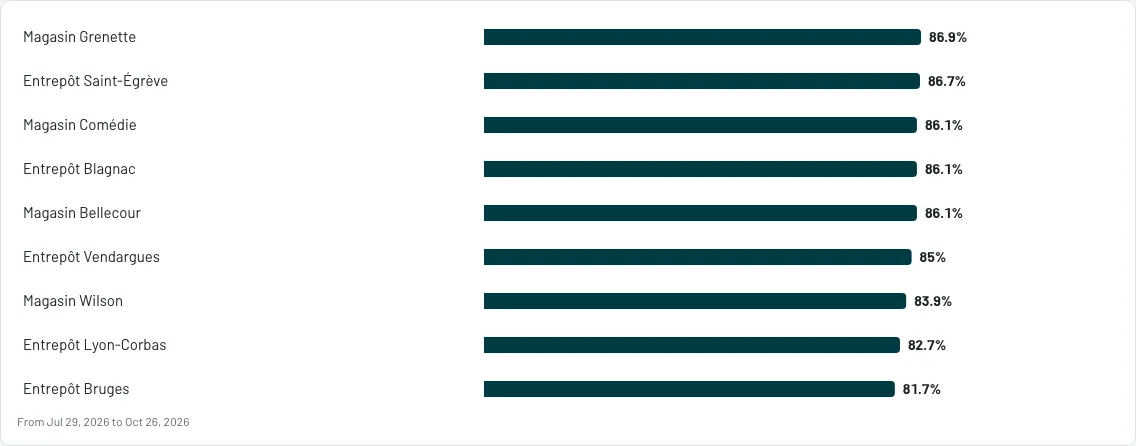
Average score by site
Section titled “Average score by site”Sites from the best to the worst average score, over 90 days; beyond ten, the rest is grouped into “Other”.
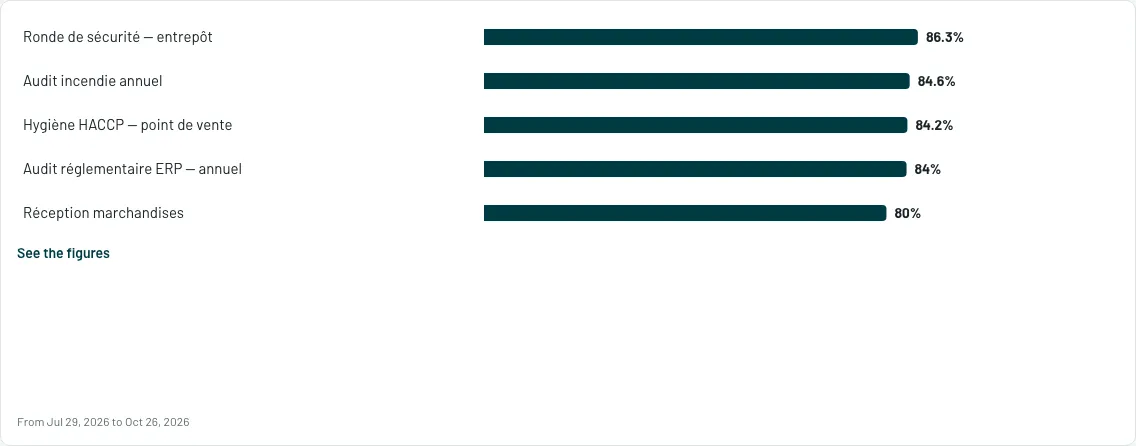
Average score by template
Section titled “Average score by template”The average score of each inspection template over 90 days, to compare the checklists with one another.
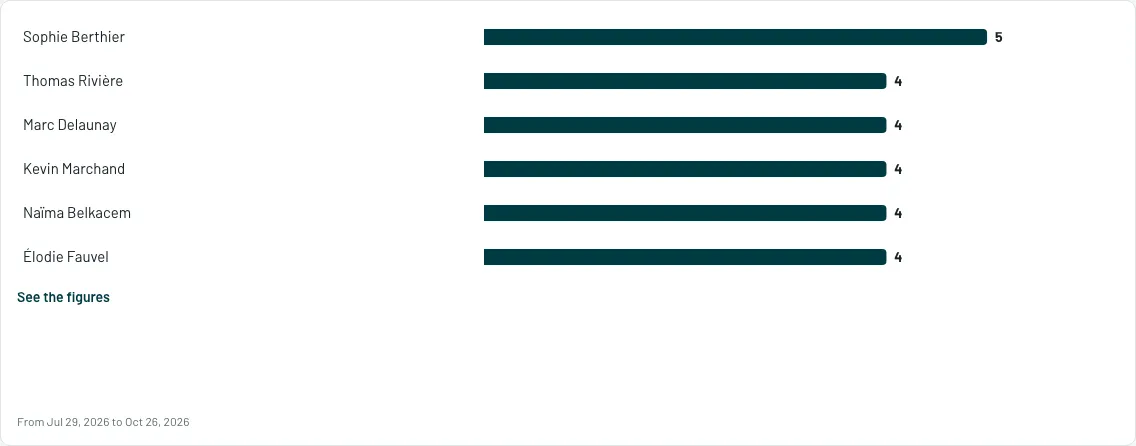
Inspections by inspector
Section titled “Inspections by inspector”Who completed how many inspections over 90 days.
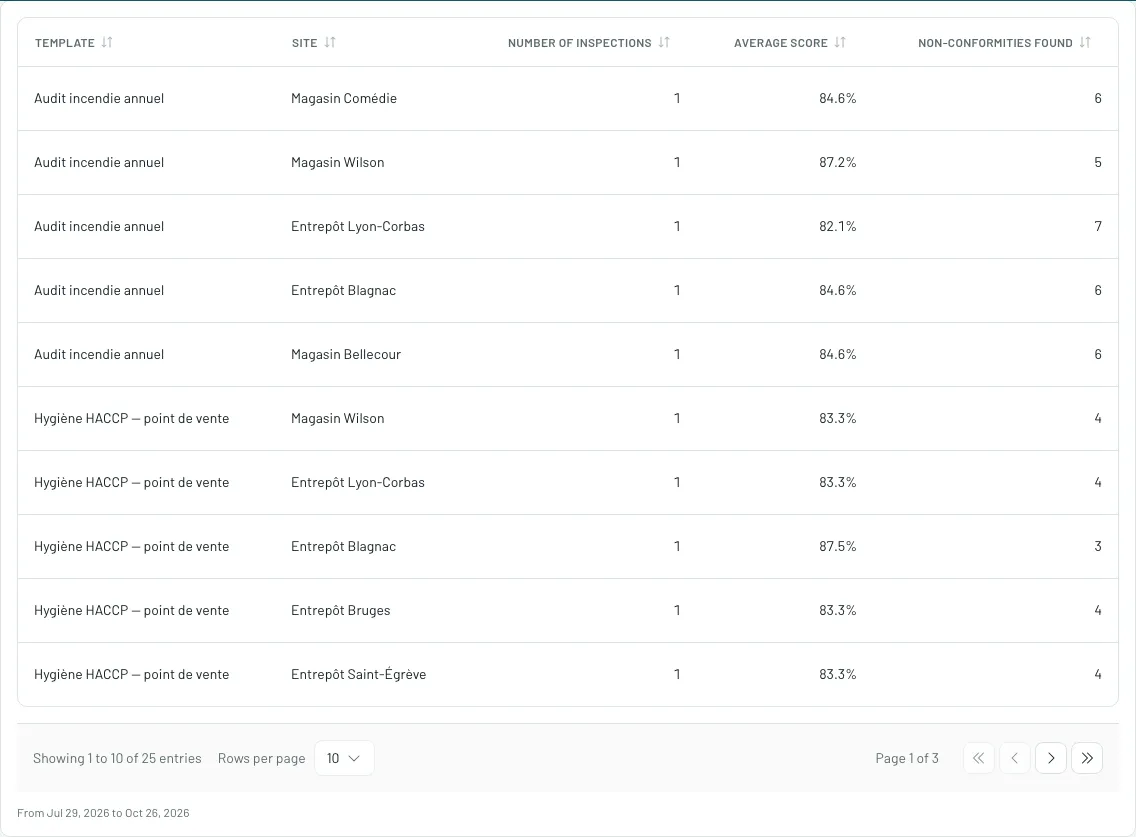
Inspections by template and site
Section titled “Inspections by template and site”A table, one row per template and site: the number of inspections, the average score and the non-conformities, over 90 days.
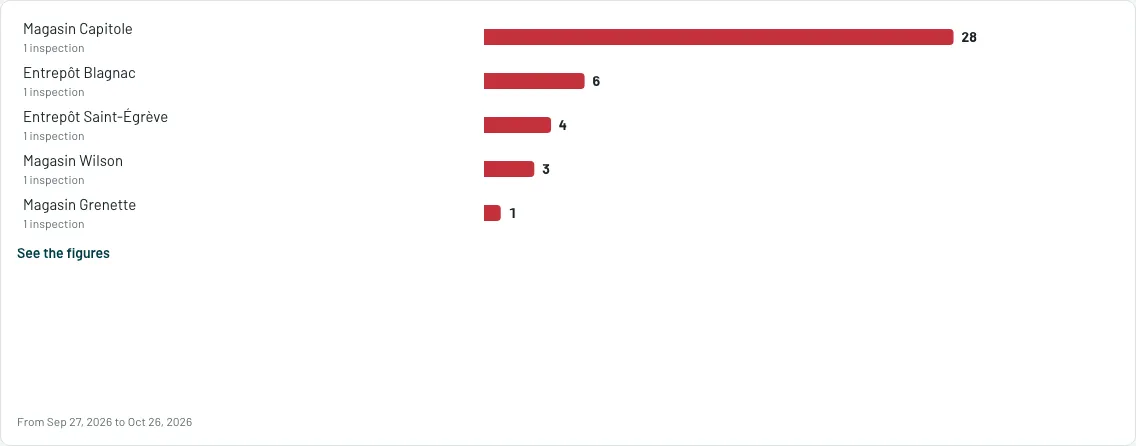
Non-conformities by site
Section titled “Non-conformities by site”The sites that find the most non-conformities over 30 days, with, under each site, the number of inspections the figure comes from.
On non-conformities
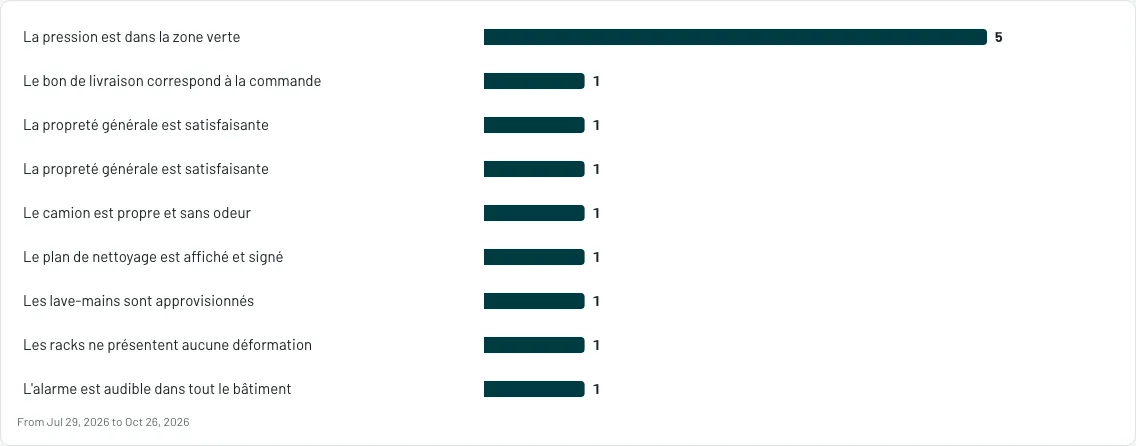
Section titled “On non-conformities”Most frequently non-conforming questions
Section titled “Most frequently non-conforming questions”The ten questions that receive the most flagged answers over 90 days: where the field stumbles.
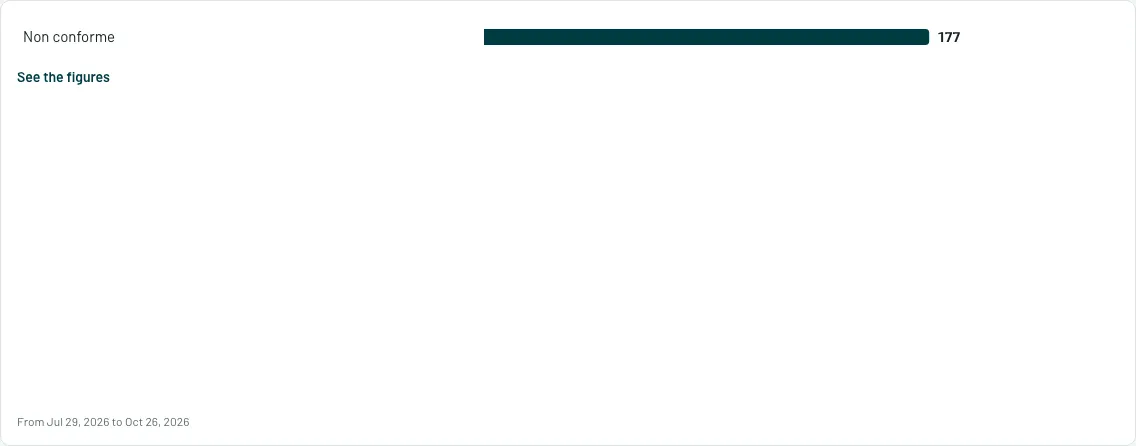
Non-conformities by answer
Section titled “Non-conformities by answer”What was answered when something was wrong: the most frequent flagged answers, over 90 days.
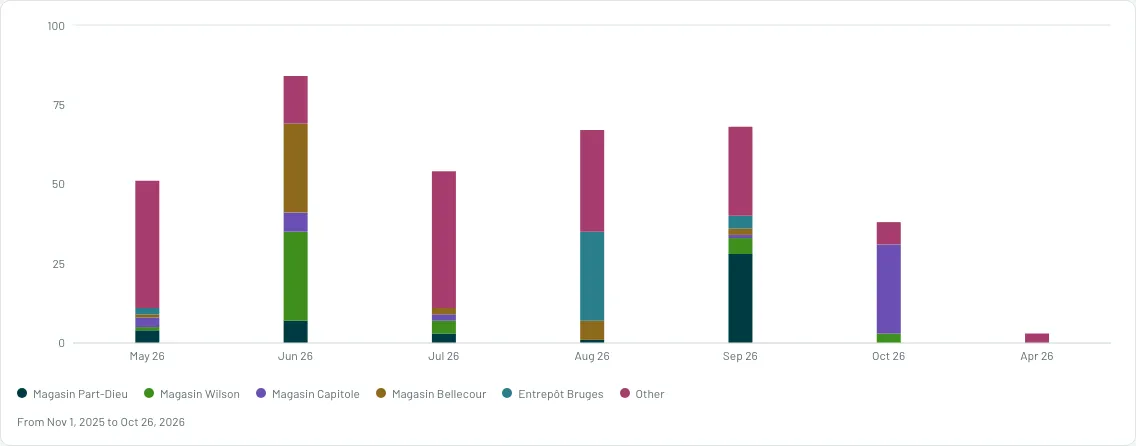
Non-conformities by site and month
Section titled “Non-conformities by site and month”Month by month over twelve months, the non-conformities of the five most affected sites, stacked.
On actions
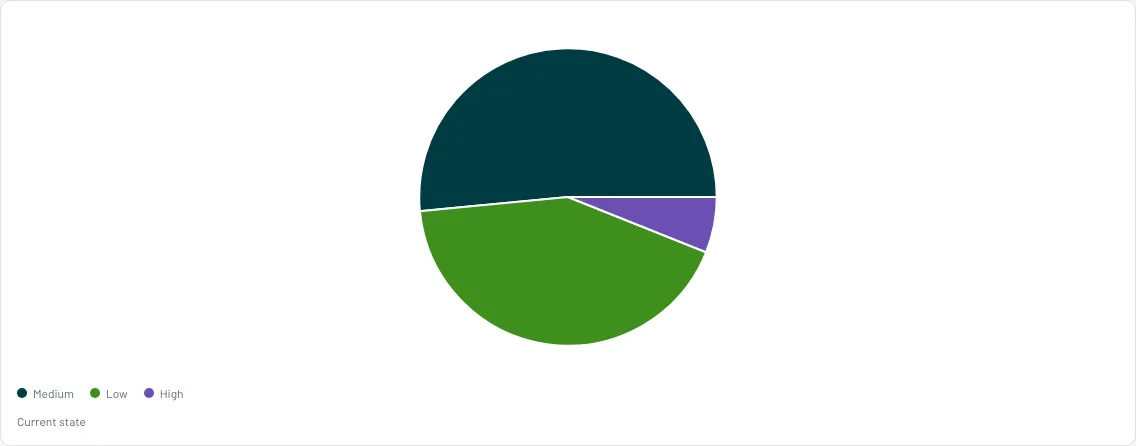
Section titled “On actions”Open actions by priority
Section titled “Open actions by priority”The actions open today, split by priority. Current state.
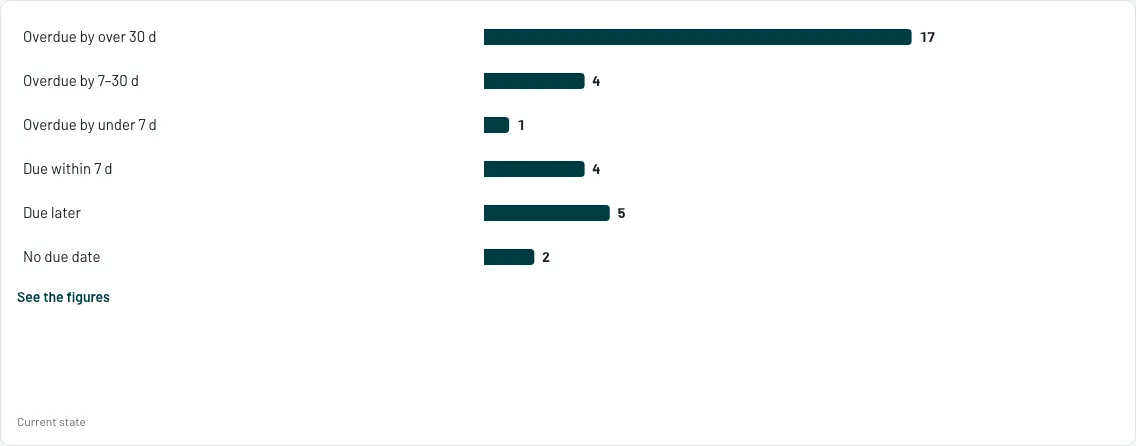
Open actions by due date
Section titled “Open actions by due date”Open actions by due date: overdue by over 30 days, by 7 to 30 days, by under 7 days, due within 7 days, due later, no due date. Current state.
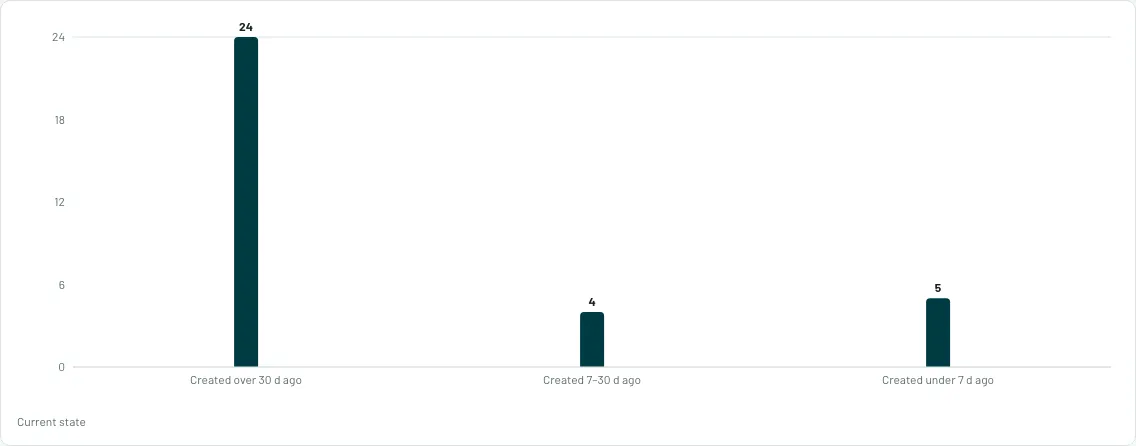
Age of open actions
Section titled “Age of open actions”How long ago the still-open actions were created, by age bracket. Current state.
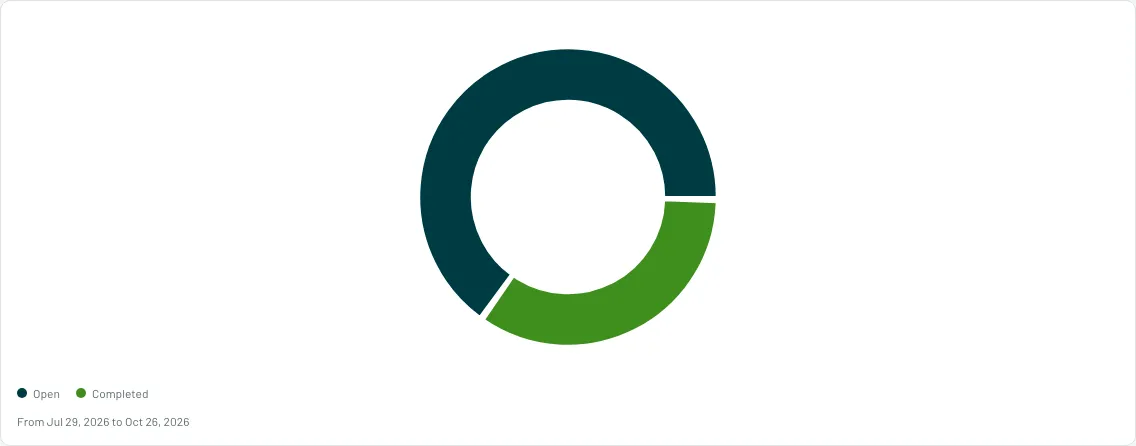
Actions by status
Section titled “Actions by status”The actions created over 90 days, by status.
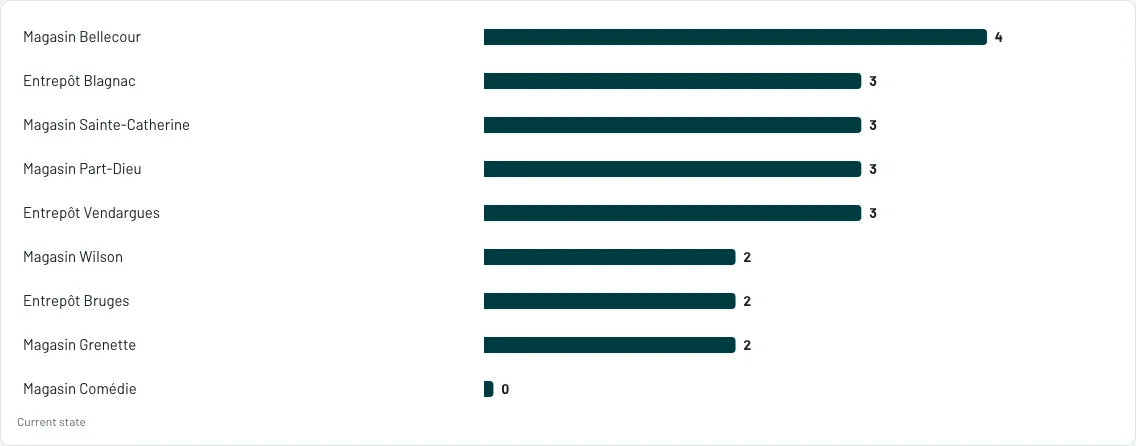
Overdue actions by site
Section titled “Overdue actions by site”The ten sites with the most overdue actions. Current state.
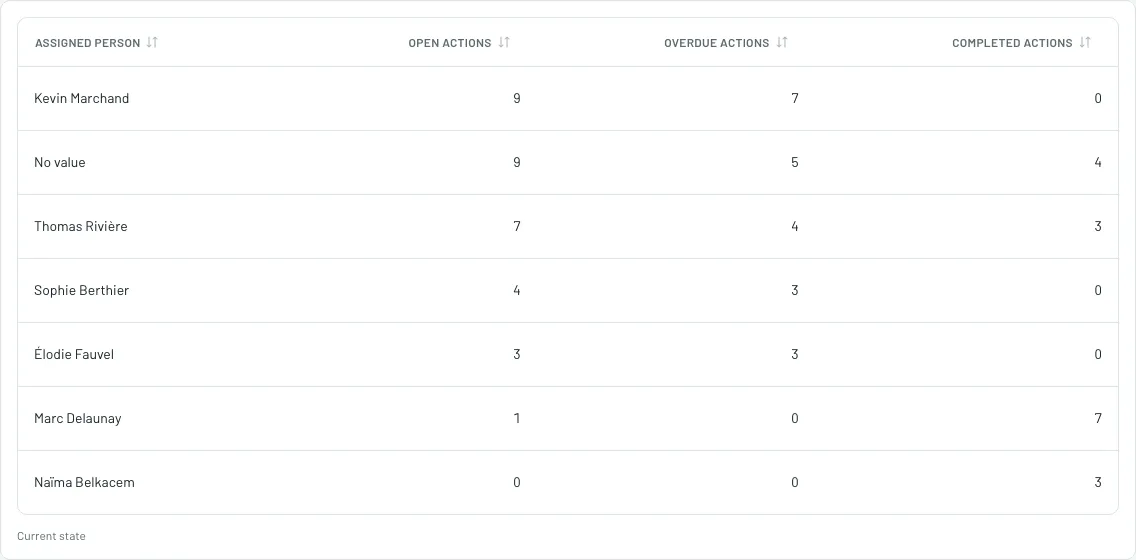
Actions by assignee
Section titled “Actions by assignee”A table, one row per person: their open, overdue and completed actions. Current state.
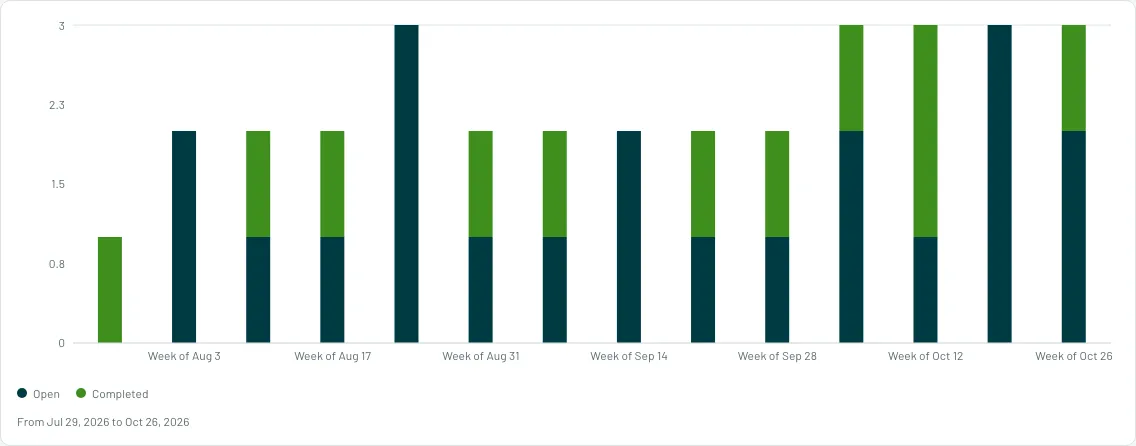
Actions created by week
Section titled “Actions created by week”The actions created each week over 90 days, stacked by status.
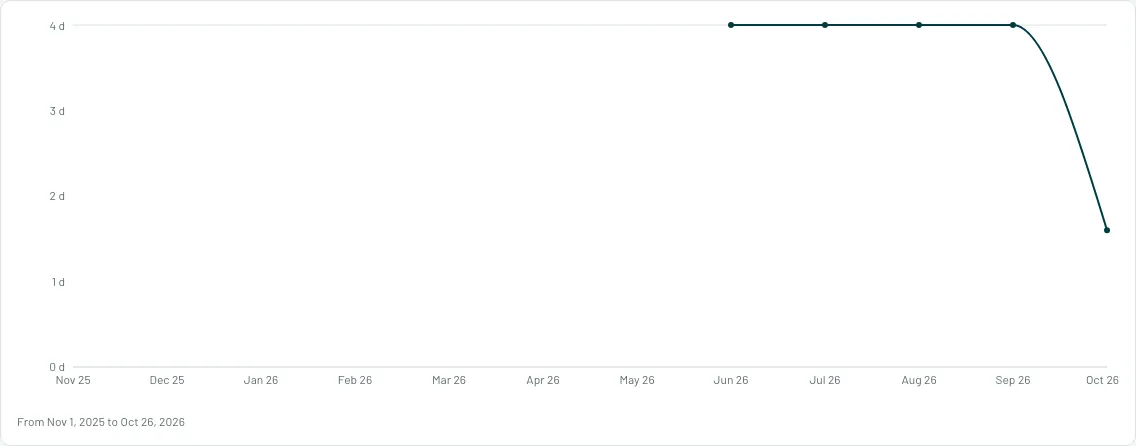
Median time to close by month
Section titled “Median time to close by month”In days, the median time between an action’s creation and its closing, by month of closing, over twelve months.
Actions by family
Section titled “Actions by family”The actions created over 90 days, by family.
Close rate
Section titled “Close rate”The share of actions created over 30 days that are completed, and the change from the 30 days before.