Reports
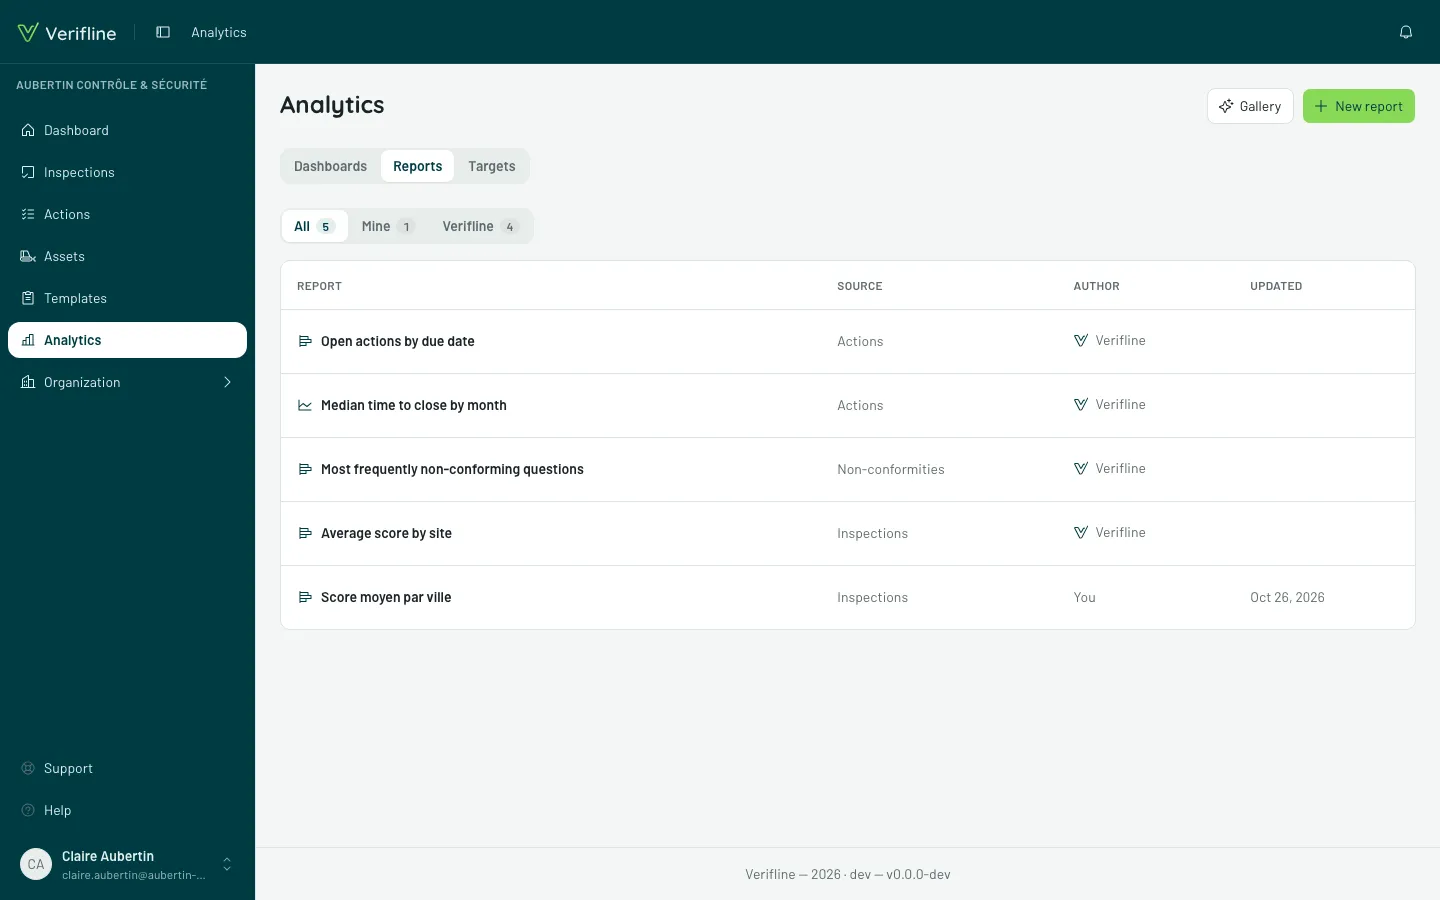
A report is a calculation on your data: a figure, a chart or a table. The Reports tab of analytics lists yours, the ones your colleagues share and Verifline’s. Each one is computed on your scope.
Start from the gallery
Section titled “Start from the gallery”The shortest way: Gallery. It offers the Verifline reports — average score by site or by month, most frequently non-conforming questions, non-conformities by answer, open actions by due date, median time to close… Each one is presented, with its screenshot, in Verifline reports.
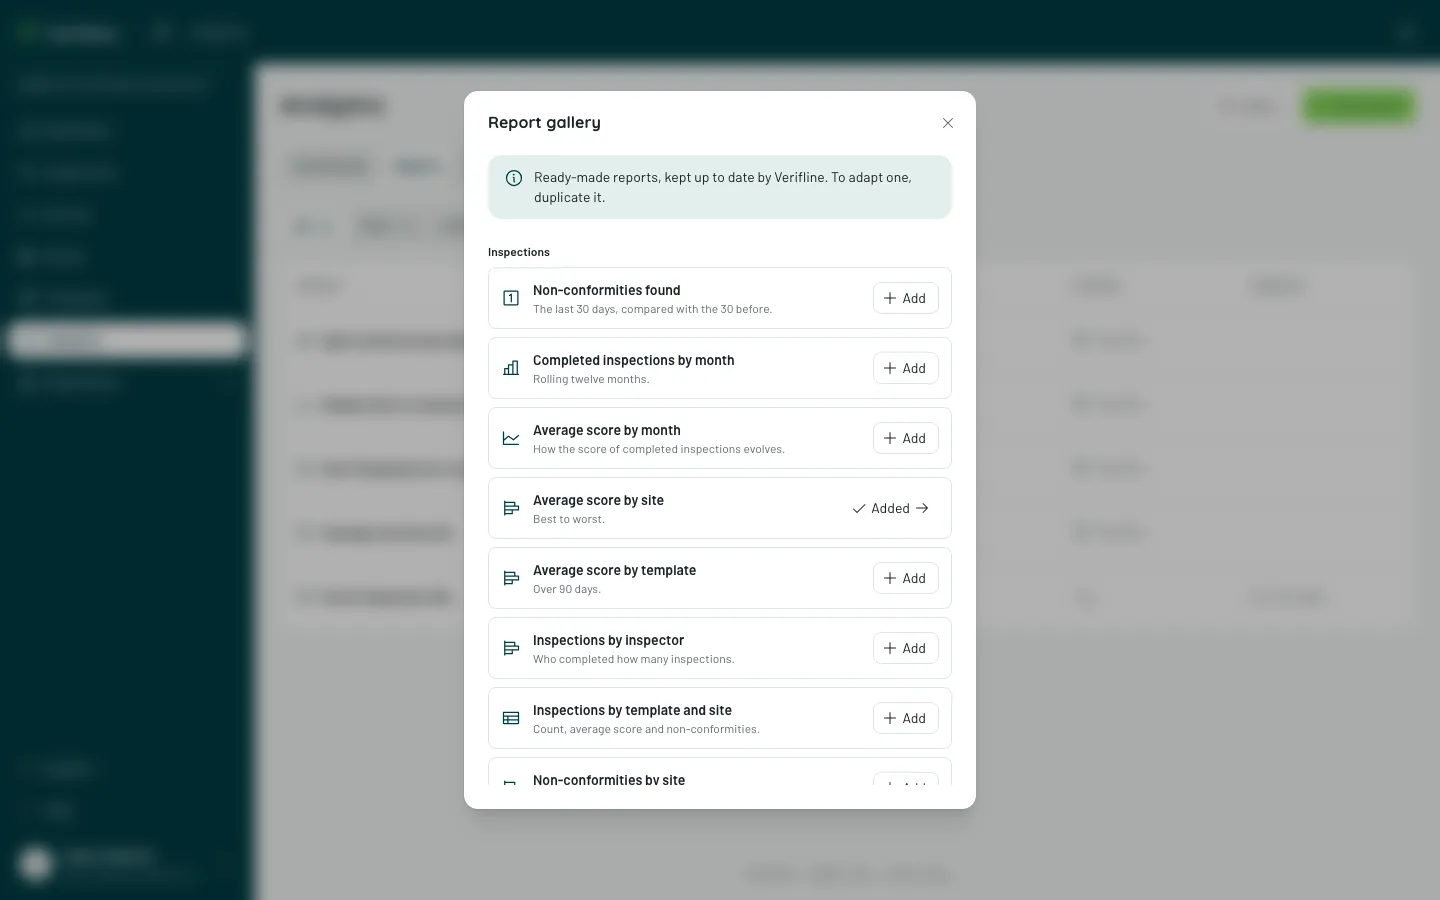
Add puts a report in your list. It is not copied: it stays signed Verifline (the logo’s “V” before the author’s name) and improves along with the application. A report already in your list shows Added.
A Verifline report cannot be edited. To adapt it, Duplicate (the ⋮ menu) makes a copy that is yours, to change at will. Remove from list takes it out of your reports without deleting anything: it stays in the gallery.
For a report the gallery does not have: Build a report.
The report list
Section titled “The report list”A report is Private — visible to you only, and labeled so — or shared with the organization. The Author column says where it comes from: You, a colleague, or Verifline.
The filters sort the list without overlapping: Mine (your reports, private or shared), Organization (the ones your colleagues share) and Verifline. Together they make All.
Read a report
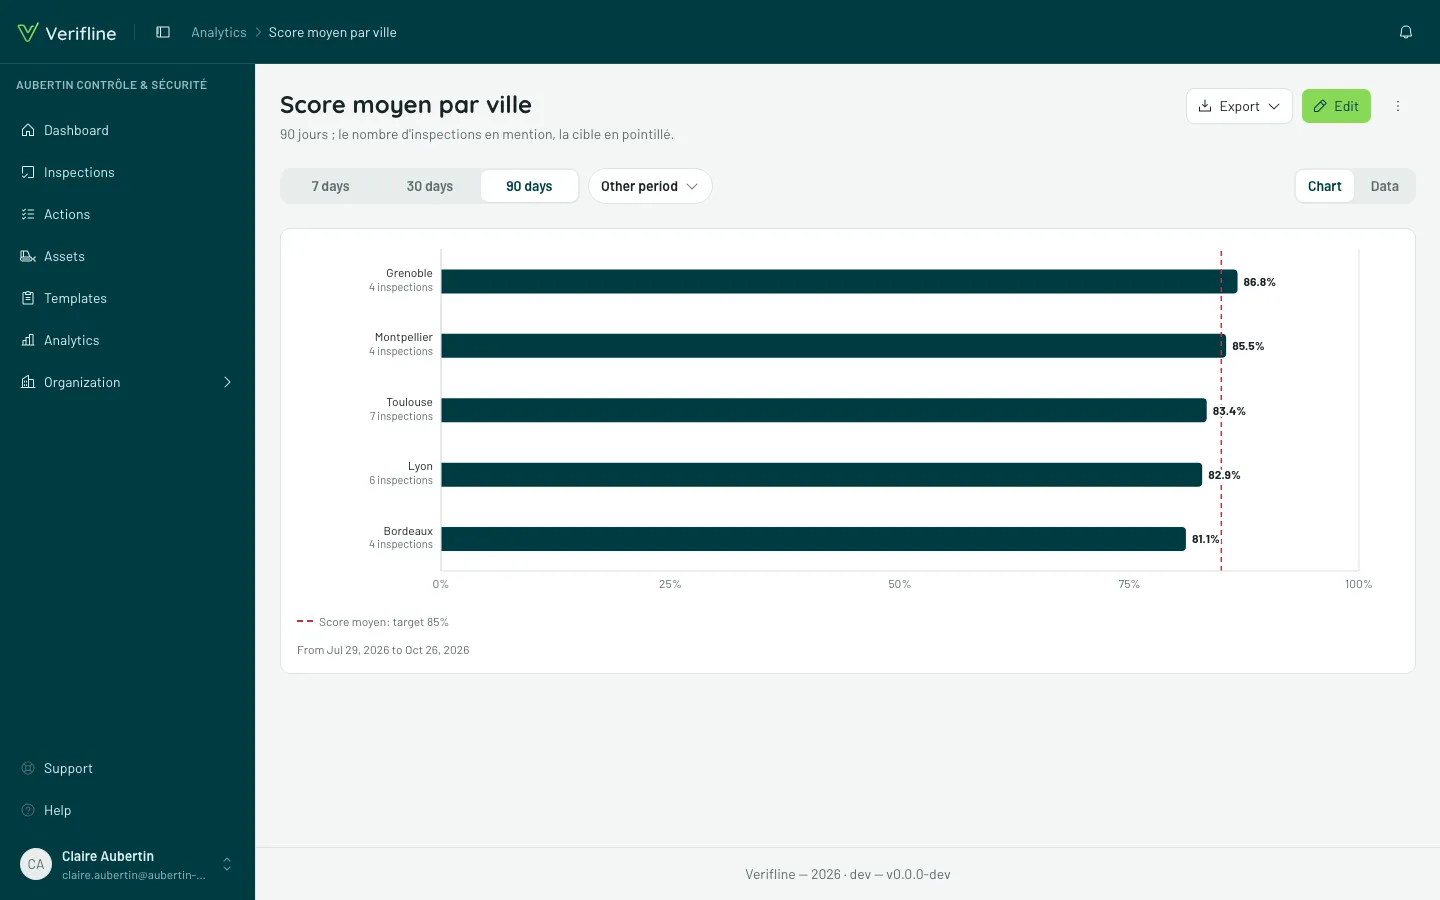
Section titled “Read a report”A report opens on its own, outside any dashboard. Its period is picked at the top and travels in the link: sharing the address shares the period. Duplicate makes a copy that is yours, whoever its author.
Three reading details:
- bars comparing a single measure read without an axis: the value is written in bold at the end of each bar, and See the figures unfolds the table right below. Columns, and bars carrying a target or several measures, keep their axis and also write their value at the end of each bar — unless stacked;
- a grouping by date also shows its empty slices, at 0;
- a report that carries a target draws it as a dashed line.
Export
Section titled “Export”Export offers three choices:
- Export CSV downloads the data as displayed — headers and values in your language;
- Export PNG downloads the report as an image: its title, the chart (or the table, if the Data tab is open), its target and period, signed Verifline. Always on a light background, sharp in a presentation;
- Copy image puts the same image on the clipboard, to paste into a presentation, a document or an email.
In a dashboard, a tile’s download icon offers the same choices for its report alone.