The home screen
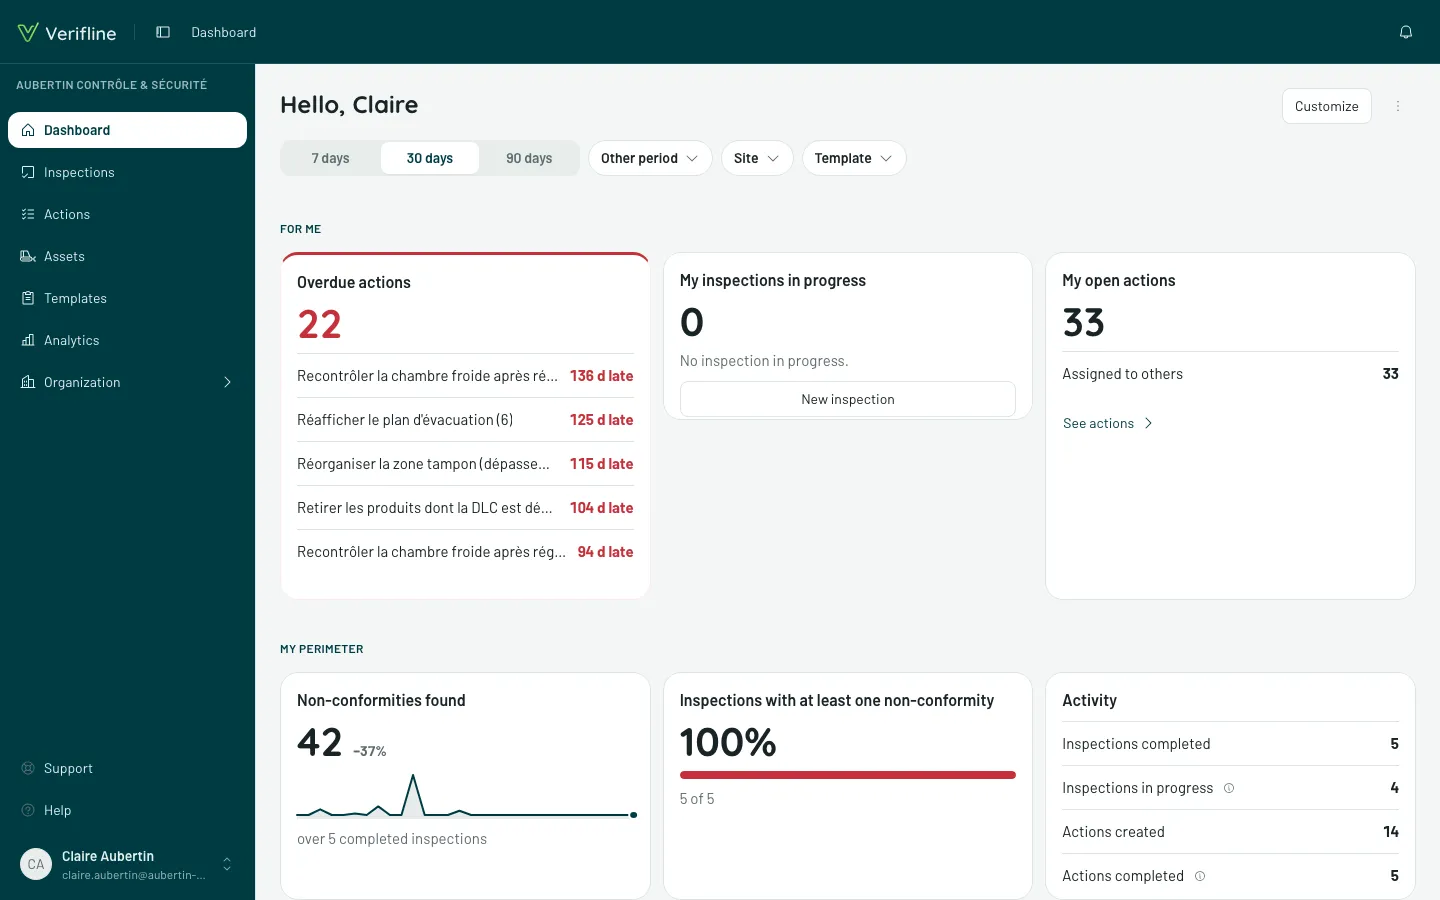
The home screen — Dashboard in the sidebar — is a dashboard like any other, built by Verifline. It opens on “Hello, {first name}” and answers three questions, in the order you ask them in the morning.
Until an inspection is completed, a tip says so under the tiles — Your results will show here —, with Resume setup while getting started is open.
“For me” — what awaits me?
Section titled ““For me” — what awaits me?”Overdue actions, My inspections in progress, My open actions: the personal band, the one that shapes the day. One click leads to the object.
“My perimeter” — how is my ground doing?
Section titled ““My perimeter” — how is my ground doing?”The numbers of your scope over the period: the Non-conformities found, with their trend and the change from the previous period; the share of Inspections with at least one non-conformity; the Activity — inspections completed and in progress, actions created and completed. Two charts break them down: Open actions by due date (overdue by more than 30 days… due later, no due date — an empty slice shows as 0) and Non-conformities by site, with under each site the number of inspections behind it.
The row of filters, under the title, reframes the whole screen: the period — 7 days, 30 days or 90 days in one tap, or Other period (12 months, this month, this quarter, a custom period…) —, then Site and Template. A chosen filter is written on its chip (“Site: Corbas warehouse”) and is undone with one click on See everything: the entire scope, a single building, a single questionnaire.
“What keeps coming back” — where does it keep rubbing?
Section titled ““What keeps coming back” — where does it keep rubbing?”The band of the Most frequent non-conformities: the questions failing most often, counted over your inspections. Clicking unfolds the detail — which inspections, which sites, which answers — the shortest path from the number to the cause. Next to it, By template ranks the templates that find the most non-conformities; clicking one filters the screen on it.
On a phone: the home, your work for the day
Section titled “On a phone: the home, your work for the day”On a phone, the Home tab does not show figures first, but your work: “Hello, …” and the date, the bell of your notifications, the inspections To resume (with their progress), Start an inspection, My actions (the three most urgent, and See all), the The organization block for whoever manages actions (late, unassigned, inspections in progress), then the Dashboard. Something to report: the Scanner stays in the middle of the tabs, at all times.
With no inspections, no dashboard and no team to follow, the home would only repeat your actions: the application then opens on Actions, and the Home tab goes away — the Scanner stays in the middle.
The dashboard stays one tap away: the Dashboard card of the home; in More, the Analytics entry for whoever opens it — it is there among the dashboards —, otherwise the Dashboard entry. It reads there with the same bands and the same filters, which scroll under your finger; Customize and the ⋮ menu stay on a computer and a tablet. There, it is the home, as described above.
A dashboard you can customize
Section titled “A dashboard you can customize”The blocks of the home screen are modules and Verifline reports: designed by Verifline, ready as is. The home you see first is the Verifline home: it improves with the application and cannot be edited. Like any dashboard, it exports and prints: Export CSV and Print are in the ⋮ menu (More actions), top right.
Whoever manages analytics sees, just before that menu, Customize. The organization then receives its own copy, the Customized home, which becomes the home screen of all its members. It is edited like any dashboard — move, resize or remove a band, add a report: Build a dashboard.
The ⋮ menu then offers Back to the Verifline home. The copy is not deleted: it stays in the list of dashboards.